A team of animal behaviorists from the University of Vienna, the University of Portsmouth, Elephant CREW, Jafuta Reserve and the University of St Andrews has found that elephants use gestures and vocal cues when they greet one another.
In their study, published in the journal Communications Biology, the group observed a month’s worth of greetings between African elephants living in the Jafuta Reserve in Zimbabwe in 2021.
Prior research has shown that elephants are highly intelligent, ranking close to dolphins. They also have complex matriarchal social structures. For this new study, the research team wondered if elephants have ways to communicate with one another that had not been observed during prior research efforts. They embarked on an observational study focused on elephant greetings.
The researchers ventured into the field at the reserve in Zimbabwe and watched and recorded encounters between elephants for one month in 2021. They observed 1,014 physical actions taken by elephants engaged in a greeting and 268 vocalizations.
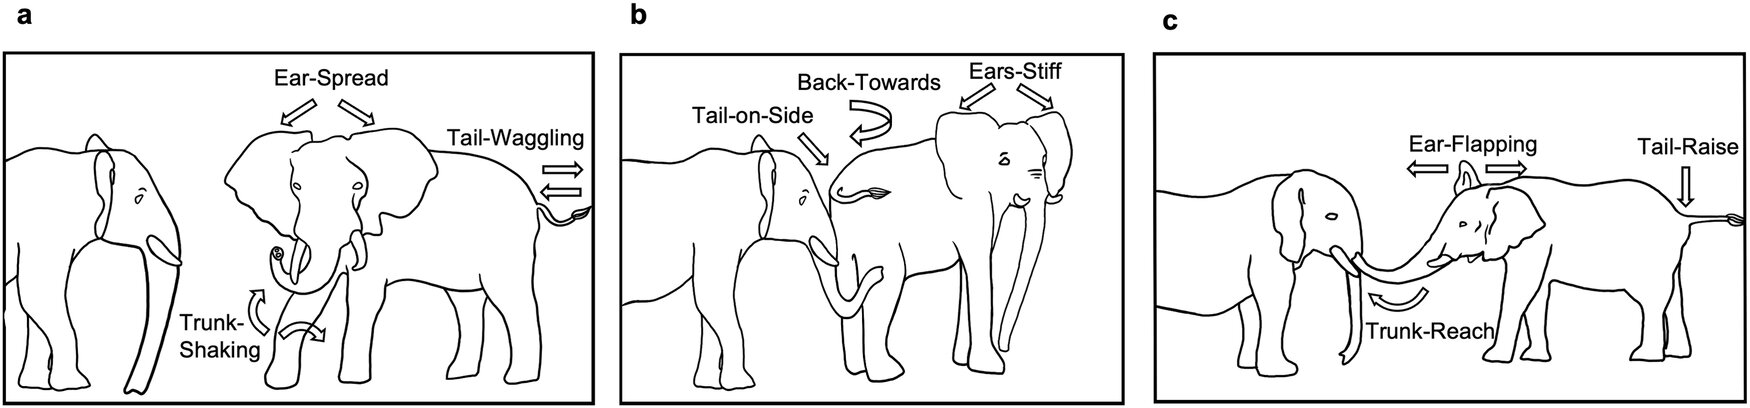
The researchers found that elephants place importance on greeting one another. When two elephants who have not seen each other for a while meet, they both engage in apparently meaningful behavior. Gestures included swinging the trunk or using it to touch, ear-flapping and ear-spreading. Vocalizations tended to be rumbles of different sorts.
The research team noted that rumblings and gestures were often combined. Behaviors during greetings also sometimes involved urination, defecation and secreting sweat in the temporal gland, which emits odors into the air.
The researchers also found that the type of behaviors differed depending on whether the two elephants were looking at one another—most were more likely to engage in gestures when they knew the other elephant was looking at them. To get the attention of elephants who hadn’t noticed them, they were also seen to engage in ear-flapping, which generates a lot of noise.
The research team concludes that the gestures and vocalizations used by the elephants appear to be part of a complicated system of communication used by the elephants to convey information during encounters. source
Tire toxicity faces fresh scrutiny after salmon die-offs
by Jim Robbins, KFF Health News
Credit: Pixabay/CC0 Public Domain
For decades, concerns about automobile pollution have focused on what comes out of the tailpipe. Now, researchers and regulators say, we need to pay more attention to toxic emissions from tires as vehicles roll down the road.
At the top of the list of worries is a chemical called 6PPD, which is added to rubber tires to help them last longer. When tires wear on pavement, 6PPD is released. It reacts with ozone to become a different chemical, 6PPD-q, which can be extremely toxic—so much so that it has been linked to repeated fish kills in Washington state.
The trouble with tires doesn’t stop there. Tires are made primarily of natural rubber and synthetic rubber, but they contain hundreds of other ingredients, often including steel and heavy metals such as copper, lead, cadmium, and zinc.
As car tires wear, the rubber disappears in particles, both bits that can be seen with the naked eye and microparticles. Testing by a British company, Emissions Analytics, found that a car’s tires emit 1 trillion ultrafine particles per kilometer driven—from 5 to 9 pounds of rubber per internal combustion car per year.
And what’s in those particles is a mystery, because tire ingredients are proprietary.
“You’ve got a chemical cocktail in these tires that no one really understands and is kept highly confidential by the tire manufacturers,” said Nick Molden, CEO of Emissions Analytics. “We struggle to think of another consumer product that is so prevalent in the world and used by virtually everyone, where there is so little known of what is in them.”
Regulators have only begun to address the toxic tire problem, though there has been some action on 6PPD.
The chemical was identified by a team of researchers, led by scientists at Washington State University and the University of Washington, who were trying to determine why coho salmon returning to Seattle-area creeks to spawn were dying in large numbers.
Working for the Washington Stormwater Center, the scientists tested some 2,000 substances to determine which one was causing the die-offs, and in 2020 they announced they’d found the culprit: 6PPD.
The Yurok Tribe in Northern California, along with two other West Coast Native American tribes, have petitioned the Environmental Protection Agency to prohibit the chemical. The EPA said it is considering new rules governing the chemical. “We could not sit idle while 6PPD kills the fish that sustain us,” said Joseph L. James, chairman of the Yurok Tribe, in a statement. “This lethal toxin has no place in any salmon-bearing watershed.”
California has begun taking steps to regulate the chemical, last year classifying tires containing it as a “priority product,” which requires manufacturers to search for and test substitutes.
“6PPD plays a crucial role in the safety of tires on California’s roads and, currently, there are no widely available safer alternatives,” said Karl Palmer, a deputy director at the state’s Department of Toxic Substances Control.
“For this reason, our framework is ideally suited for identifying alternatives to 6PPD that ensure the continued safety of tires on California’s roads while protecting California’s fish populations and the communities that rely on them.”
The U.S. Tire Manufacturers Association says it has mobilized a consortium of 16 tire manufacturers to carry out an analysis of alternatives. Anne Forristall Luke, USTMA president and CEO, said it “will yield the most effective and exhaustive review possible of whether a safer alternative to 6PPD in tires currently exists.”
Molden, however, said there is a catch. “If they don’t investigate, they aren’t allowed to sell in the state of California,” he said. “If they investigate and don’t find an alternative, they can go on selling. They don’t have to find a substitute. And today there is no alternative to 6PPD.”
California is also studying a request by the California Stormwater Quality Association to classify tires containing zinc, a heavy metal, as a priority product, requiring manufacturers to search for an alternative. Zinc is used in the vulcanization process to increase the strength of the rubber.
When it comes to tire particles, though, there hasn’t been any action, even as the problem worsens with the proliferation of electric cars. Because of their quicker acceleration and greater torque, electric vehicles wear out tires faster and emit an estimated 20% more tire particles than the average gas-powered car.
A recent study in Southern California found tire and brake emissions in Anaheim accounted for 30% of PM2.5, a small-particulate air pollutant, while exhaust emissions accounted for 19%. Tests by Emissions Analytics have found that tires produce up to 2,000 times as much particle pollution by mass as tailpipes.
These particles end up in water and air and are often ingested. Ultrafine particles, even smaller than PM2.5, are also emitted by tires and can be inhaled and travel directly to the brain. New research suggests tire microparticles should be classified as a pollutant of “high concern.”
In a report issued last year, researchers at Imperial College London said the particles could affect the heart, lungs, and reproductive organs and cause cancer.
People who live or work along roadways, often low-income, are exposed to more of the toxic substances.
Tires are also a major source of microplastics. More than three-quarters of microplastics entering the ocean come from the synthetic rubber in tires, according to a report from the Pew Charitable Trusts and the British company Systemiq.
And there are still a great many unknowns in tire emissions, which can be especially complex to analyze because heat and pressure can transform tire ingredients into other compounds.
One outstanding research question is whether 6PPD-q affects people, and what health problems, if any, it could cause. A study published in Environmental Science & Technology Letters found high levels of the chemical in urine samples from a region of South China, with levels highest in pregnant women.
The discovery of 6PPD-q, Molden said, has sparked fresh interest in the health and environmental impacts of tires, and he expects an abundance of new research in the coming years. “The jigsaw pieces are coming together,” he said. “But it’s a thousand-piece jigsaw, not a 200-piece jigsaw.”
A new paper published today (April 24) in the journal Nature by an international team of 279 scientists led by the Royal Botanic Gardens, Kew presents the most up-to-date understanding of the flowering plant tree of life.
Using 1.8 billion letters of genetic code from more than 9,500 species covering almost 8,000 known flowering plant genera (ca. 60%), this incredible achievement sheds new light on the evolutionary history of flowering plants and their rise to ecological dominance on Earth.
The study’s authors believe the data will aid future attempts to identify new species, refine plant classification, uncover new medicinal compounds, and conserve plants in the face of climate change and biodiversity loss.
The major milestone for plant science, led by Kew and involving 138 organizations internationally, was built on 15 times more data than any comparable studies of the flowering plant tree of life. Among the species sequenced for this study, more than 800 have never had their DNA sequenced before.
The sheer amount of data unlocked by this research, which would take a single computer 18 years to process, is a huge stride towards building a tree of life for all 330,000 known species of flowering plants—a massive undertaking by Kew’s Tree of Life Initiative.
Dr. Alexandre Zuntini, Research Fellow at RBG Kew, says, “Analyzing this unprecedented amount of data to decode the information hidden in millions of DNA sequences was a huge challenge. But it also offered the unique opportunity to reevaluate and extend our knowledge of the plant tree of life, opening a new window to explore the complexity of plant evolution.”
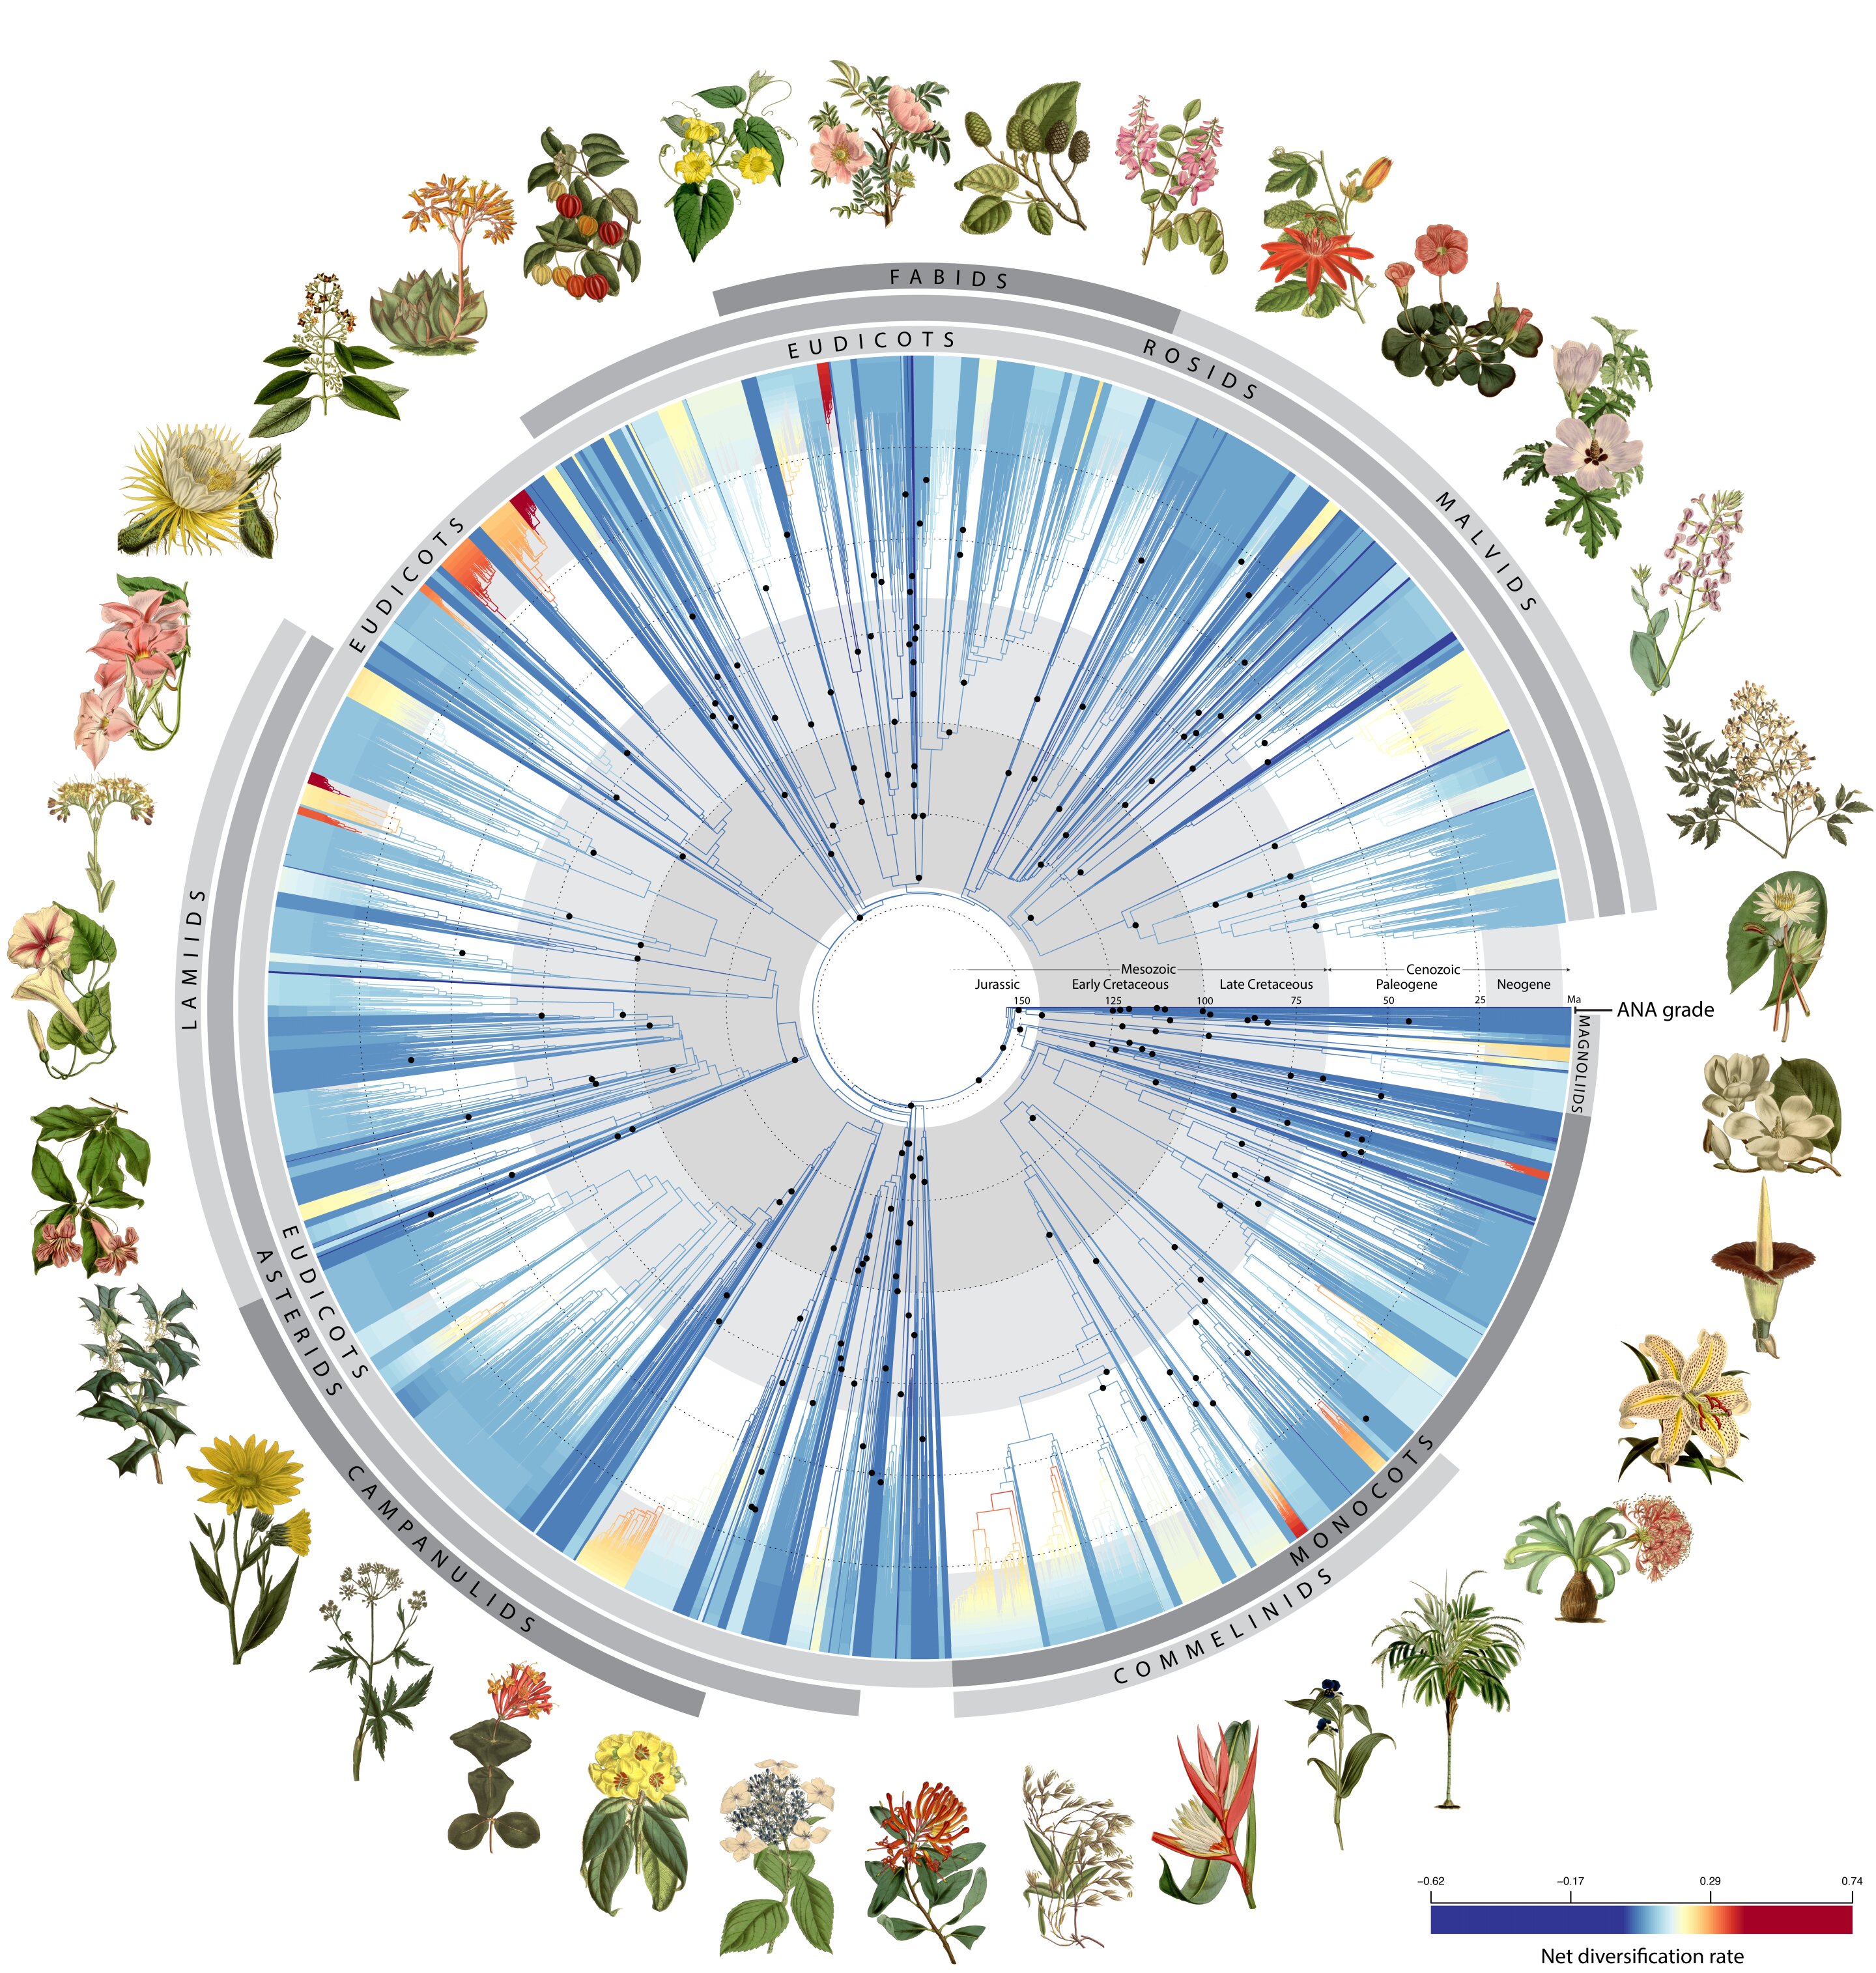
The Angiosperm Tree of Life was built on 15 times more data than comparable studies and was involved sequencing more than 9,500 different species of flowering plants. Credit: RBG Kew
Unlocking historic herbarium specimens for cutting-edge research
The flowering plant tree of life, much like our own family tree, enables us to understand how different species are related to each other. The tree of life is uncovered by comparing DNA sequences between different species to identify changes (mutations) that accumulate over time like a molecular fossil record.
Our understanding of the tree of life is improving rapidly in tandem with advances in DNA sequencing technology. For this study, new genomic techniques were developed to magnetically capture hundreds of genes and hundreds of thousands of letters of genetic code from every sample, orders of magnitude more than earlier methods.
A key advantage of the team’s approach is that it enables a wide diversity of plant material, old and new, to be sequenced, even when the DNA is badly damaged. The vast treasure troves of dried plant material in the world’s herbarium collections, which comprise nearly 400 million scientific specimens of plants, can now be studied genetically.
Using such specimens, the team successfully sequenced a sandwort specimen (Arenaria globiflora) collected nearly 200 years ago in Nepal and, despite the poor quality of its DNA, were able to place it in the tree of life.
The team even analyzed extinct plants, such has the Guadalupe Island olive (Hesperelaea palmeri), which has not been seen alive since 1875. In fact, 511 of the species sequenced are already at risk of extinction, according to the IUCN Red List, including three more like Hesperelaea that are already extinct.
Professor William Baker, Senior Research Leader–Tree of Life, says, “In many ways this novel approach has allowed us to collaborate with the botanists of the past by tapping into the wealth of data locked up in historic herbarium specimens, some of which were collected as far back as the early 19th century.
“Our illustrious predecessors such as Charles Darwin or Joseph Hooker could not have anticipated how important these specimens would be in genomic research today. DNA was not even discovered in their lifetimes!
“Our work shows just how important these incredible botanical museums are to ground-breaking studies of life on Earth. Who knows what other undiscovered science opportunities lie within them?”
Across all 9,506 species sequenced, more than 3,400 came from material sourced from 163 herbaria in 48 countries. Additional material from plant collections around the world (e.g., DNA banks, seeds, living collections) have been vital for filling key knowledge gaps to shed new light on the history of flowering plant evolution. The team also benefited from publicly available data for more than 1,900 species, highlighting value of the open science approach to future genomic research.
Illuminating Darwin’s abominable mystery
Flowering plants alone account for about 90% of all known plant life on land and are found virtually everywhere on the planet—from the steamiest tropics to the rocky outcrops of the Antarctic Peninsula. And yet, our understanding of how these plants came to dominate the scene soon after their origin has baffled scientists for generations, including Charles Darwin.
Flowering plants originated more than 140 million years ago after which they rapidly overtook other vascular plants including their closest living relatives—the gymnosperms (non-flowering plants that have naked seeds, such as cycads, conifers, and ginkgo).
Darwin was mystified by the seemingly sudden appearance of such diversity in the fossil record. In an 1879 letter to Joseph Dalton Hooker, his close confidant and Director of RBG Kew, he wrote, “The rapid development as far as we can judge of all the higher plants within recent geological times is an abominable mystery.”
Utilizing 200 fossils, the authors scaled their tree of life to time, revealing how flowering plants evolved across geological time. They found that early flowering plants did indeed explode in diversity, giving rise to more than 80% of the major lineages that exist today shortly after their origin.
However, this trend then declined to a steadier rate for the next 100 million years until another surge in diversification about 40 million years ago, coinciding with a global decline in temperatures. These new insights would have fascinated Darwin and will surely help today’s scientists grappling with the challenges of understanding how and why species diversify.
A truly global collaboration
Assembling a tree of life this extensive would have been impossible without Kew’s scientists collaborating with many partners across the globe. In total, 279 authors were involved in the research, representing many different nationalities from 138 organizations in 27 countries. They include the Genomics for Australian Plants (GAP) consortium who were early adopters of the team’s techniques and who worked in close collaboration with Kew to maximize the number of Australian plant species in the tree.
International collaborators also shared their unique botanical expertise, as well as many precious plant samples from around the world that could not be obtained without their help. The comprehensive nature of the tree is in no small part a result of this wonderful partnership.
Dr. Mabel Lum, Program Manager at Bioplatforms Australia and from the GAP consortium, says, “We are proud to be a major partner and collaborator in RBG Kew’s effort to build global research infrastructure to advance our understanding of flowering plant tree of life. This fruitful collaboration underscored our commitment to fostering innovation and collaboration in scientific research, providing a springboard for future discoveries that will help shape our understanding of the natural world for generations to come.”
Putting the plant tree of life to good use
The flowering plant tree of life has enormous potential in biodiversity research. This is because, just as one can predict the properties of an element based on its position in the periodic table, the location of a species in the tree of life allows us to predict its properties. The new data will thus be invaluable for enhancing many areas of science and beyond.
To enable this, the tree and all of the data that underpin it have been made openly and freely accessible to both the public and scientific community, including through the Kew Tree of Life Explorer. The study’s authors believe such open access is key to democratizing access to scientific data across the globe.
Open access will also help scientists to make the best use of the data, such as combining it with artificial intelligence to predict which plant species may include molecules with medicinal potential. Similarly, the tree of life can be used to better understand and predict how pests and diseases are going to affect the plants of the U.K. in the future. Ultimately, the authors note, the applications of this data will be driven by the ingenuity of the scientists accessing it.
Dr. Melanie-Jayne Howes, Senior Research Leader at RBG Kew who was not an author on the study but will make use of the data in her research, says, “Plant chemicals have inspired many pharmaceutical drugs, but still have great untapped potential to aid future drug discovery. The challenge is knowing which to investigate scientifically in the search for new medicines out of the ca. 330,000 flowering plant species.
“At Kew we are applying AI to predict which plant species contain chemicals with pharmaceutical potential for malaria. The availability of this vast new dataset offers exciting opportunities to enhance these predictions and hence accelerate drug discovery from plants for malaria and other diseases too.”
Remarkable species in the flowering plant tree of life
Extinct due to feral goats: Hesperelaea palmeri, also known as Guadalupe Island olive (olivo de la Isla de Guadalupe). Sequenced from an herbarium specimen at Kew collected on Guadalupe Island, off Baja California, Mexico in 1875 by medical doctor Edward Palmer. A tree belonging to the olive family (Oleaceae), it is now extinct because of overgrazing by non-native goats.
Oldest specimen sequenced: Arenaria globiflora, also known as Nepalese sandwort. Sequenced from an herbarium specimen at Kew collected in 1829 by Nathaniel Wallich. This remarkable specimen comes from a Himalayan mountain plant that grows at over 3,600m.
Parasitic plant family mystery solved: Pilostyles aethiopica, member of the stemsucker family (Apodanthaceae). Sequenced from plant tissue collected in Zimbabwe in 2012 by Kew’s Sidonie Bellot. This weird parasite lives inside the branches of other plants and is only visible when it erupts into flower. Previously thought to be closely related to pumpkins and begonias (Cucurbitales), study found it sits in the group Malpighiales.
Bizarre tropical tree reclassified: Medusanthera laxiflora, member of the buff-beech family (Stemonuraceae). Sequenced from an herbarium specimen at Kew collected in Indonesian New Guinea in 1993. This small tropical tree with bizarre pin fruits was previously classified alongside the holly family. New tree of life has reclassified its genus and family into a whole new order.
Bamboo from Hooker’s 1850s Himalayan expedition: Cephalostachyum capitatum, member of the grass family (Poaceae). Sequenced from an herbarium specimen collected in India in 1850 by Joseph Hooker, RBG Kew’s second director, and his friend Thomas Thomson.
Medicinal plant sequenced for the very first time: Alstonia spectabilis, also known as Kroti metan by Tetun people. Sequenced from an herbarium specimen at Kew collected in Papua New Guinea in 1954. This massive, 20m tall tree is found in the rainforests of SE Asia and Australia. Despite being medicinally important to the Tetun people of West Timor to treat malaria, as well as being a valuable source of timber, its DNA has never been sequenced before.
Bren Smith harvests algae grown in the ocean near Branford, Connecticut.
Bren Smith and his GreenWave organization are helping lay the foundations for a generation of seaweed-growing farmers in the United States, while working to build a network of producers and buyers.
Seen from a boat, GreenWave’s farm seems unimpressive—little more than lines of white and black buoys, a few hundred yards (meters) off the Connecticut coast.
But beneath the dark Atlantic waters, suspended from ropes tied between the buoys around six feet (two meters) down, seaweed in varying shades of brown undulates.
GreenWave, which uses no pesticides or herbicides, last year harvested more than 20 metric tons of kelp from this location and from another one a bit farther east.
While seaweed farming has been practiced for decades in Asia, such aquaculture is a relatively new phenomenon in the US.
Training others
Bren Smith, who is Canadian, worked in industrial fishing for years before turning to so-called regenerative aquaculture—cultivating marine resources while caring for their ecosystem and even helping it flourish.
Research shows that kelp absorbs more carbon dioxide (CO2) than a land forest of comparable surface area, while providing nutrients and a habitat for other living organisms.
Once an crop is harvested, it is used primarily in food products, cosmetics or as natural fertilizer.
GreenWave also cultivates mussels and oysters, which help purify surrounding seawater.
Smith hoists up a rope covered with algae at his farm in Atlantic waters off the Connecticut coast.
But its ambition reaches far beyond the bounds of its sea “farm,” which has been kept intentionally small.
“We’re training the next generation of ocean farmers,” said Smith, author of the book “Eat Like a Fish: My Adventure as a Fisherman Turned Ocean Farmer.”
To do so, GreenWave has developed a suite of training tools, from brochures to videos. Nearly 8,000 people have profited from the training.
GreenWave helped “connect me to other farms and farmers and disseminate the knowledge that our industry is building,” said Ken Sparta, who has been growing seaweed on his Spartan Farms near Portland, Maine since 2019.
“I’m not sure where our industry would be without them, and it certainly wouldn’t be growing at this rate,” Sparta said.
‘Collaborate, not compete’
GreenWave also issues starter grants of up to $25,000 per project, thanks to a combination of private donations and public subsidies.
And it established the Seaweed Source platform, which brings producers together with buyers, with more than 65 companies now involved.
Crucially, GreenWave developed an inexpensive technique allowing harvested seaweed to be preserved for up to 10 months, whereas kelp generally begins deteriorating after only a few hours.
“We don’t do policy stuff,” said Smith, standing on the bridge of his small boat. “It’s just, like, what do you need to do to be successful?”
Smith harvests tons of algae every year without use of pesticides or herbicides, and he helps teach others how to do the same.
Despite seaweed’s proven ability to capture carbon dioxide, Smith has not yet tried to include carbon credits in his business model.
“It’s seeming like markets aren’t great at incentivizing carbon,” the 51-year-old told AFP.
Along with GreenWave co-founder Emily Stengel, Smith has had to confront the challenges of a warming climate.
“When Bren started farming, he would be out planting in maybe the end of October,” said Toby Sheppard Bloch, director of infrastructure at GreenWave.
“And in 2021, we were out planting at the end of December… We lost two months of growing season,” due to warming waters.
With harvests plummeting, “We realized that something had to change if we were going to continue to farm these waters,” said Bloch.
GreenWave had the idea of creating a seed bank—where seeds could get an early start before being put in the sea—which helped farmers gain two months of growing time.
They used electric wine coolers as a cheaper alternative to a laboratory cold room.
The seed bank is open to any farmer to use, and seeds can be deposited or taken out at any time.
“Our belief is, really, what we need to do is collaborate and not compete,” said Smith, wearing his trademark green cap.
“Let’s bring together fishermen and all these folks that are being impacted by climate change and move them into solutions and breathing life back into the ocean.”
Space scientists led by the University of Leicester have combined evidence from simulations, observations and analysis of meteorites to recreate the orbital instability caused as the giant planets of our solar system moved into their current locations, known for 20 years as the Nice model.
The findings are published in the journal Science and presented at the European Geological Union General Assembly in Vienna.
At the beginning of the solar system, the giant planets—Jupiter, Saturn, Uranus, and Neptune—had more circular and more compact orbits than they do today. Previous research has established that orbital instability in the solar system changed that orbital configuration and caused smaller planetesimals to be dispersed. Many of these collided with the inner terrestrial planets in what scientists have termed the Late Heavy Bombardment.
Lead author Dr. Chrysa Avdellidou from the University of Leicester School of Physics and Astronomy said, “The question is, when did it happen? The orbits of these planets destabilized due to some dynamical processes and then took their final positions that we see today. Each timing has a different implication, and it has been a great matter of debate in the community.”
“What we have tried to do with this work is to not only do a pure dynamical study but combine different types of studies, linking observations, dynamical simulations, and studies of meteorites.”
They focused on a type of meteorite known as enstatite chondrites, which have a very similar composition to Earth and very similar isotopic ratios, which means they were formed in our neighborhood. By making spectroscopic observations using ground-based telescopes, they linked those meteorites to their source: a family of fragments in the asteroid belt known as Athor.
This suggests that Athor was originally much larger and formed closer to the sun and that it suffered a collision that reduced its size out of the asteroid belt.
To explain how Athor ended up in the asteroid belt, the scientists tested various scenarios using dynamical simulations, concluding that the most likely explanation was the gravitational instability that shifted the giant planets to their current orbits. Analysis of the meteorites showed that this occurred no earlier than 60 million years after the solar system began to form.
Previous evidence from asteroids in Jupiter’s orbit has also put constraints on how late this event occurred, with scientists concluding that the gravitational instability must have occurred between 60 and 100 million years after the birth of the solar system, 4.56 billion years ago.
Previous evidence has shown that Earth’s moon was formed during this period, with one hypothesis being that a planetesimal known as Theia collided with Earth, and debris from that collision formed the moon.
Timing of the orbital instability is important as it determines when some of the familiar features of our solar system would develop—and may even have had an impact on the habitability of our planet.
Dr. Avdellidou added, “It’s like you have a puzzle, you understand that something should have happened, and you try to put events in the correct order to make the picture that you see today. The novelty with the study is that we are not only doing pure dynamical simulations, or only experiments, or only telescopic observations.”
“There were once five inner planets in our solar system and not four, so that could have implications for other things, like how we form habitable planets. Questions like, when exactly did objects come delivering volatile organics to our planet to Earth and Mars?”
Marco Delbo, co-author of the study and Director of Research at Nice Observatory in France, said, “The timing is very important because a lot of planetesimals populated our solar system at the beginning. And the instability clears them, so if that happens 10 million years after the beginning of the solar system, you clear the planetesimals immediately, whereas if you do it after 60 million years, you have more time to bring materials to Earth and Mars.”
More information: Chrysa Avdellidou et al, Dating the Solar System’s giant planet orbital instability using enstatite meteorites, Science (2024). DOI: 10.1126/science.adg8092
(turn up resolution (up to 8k HD) and turn down (or off) volume before playing) (also viewable in 3D)
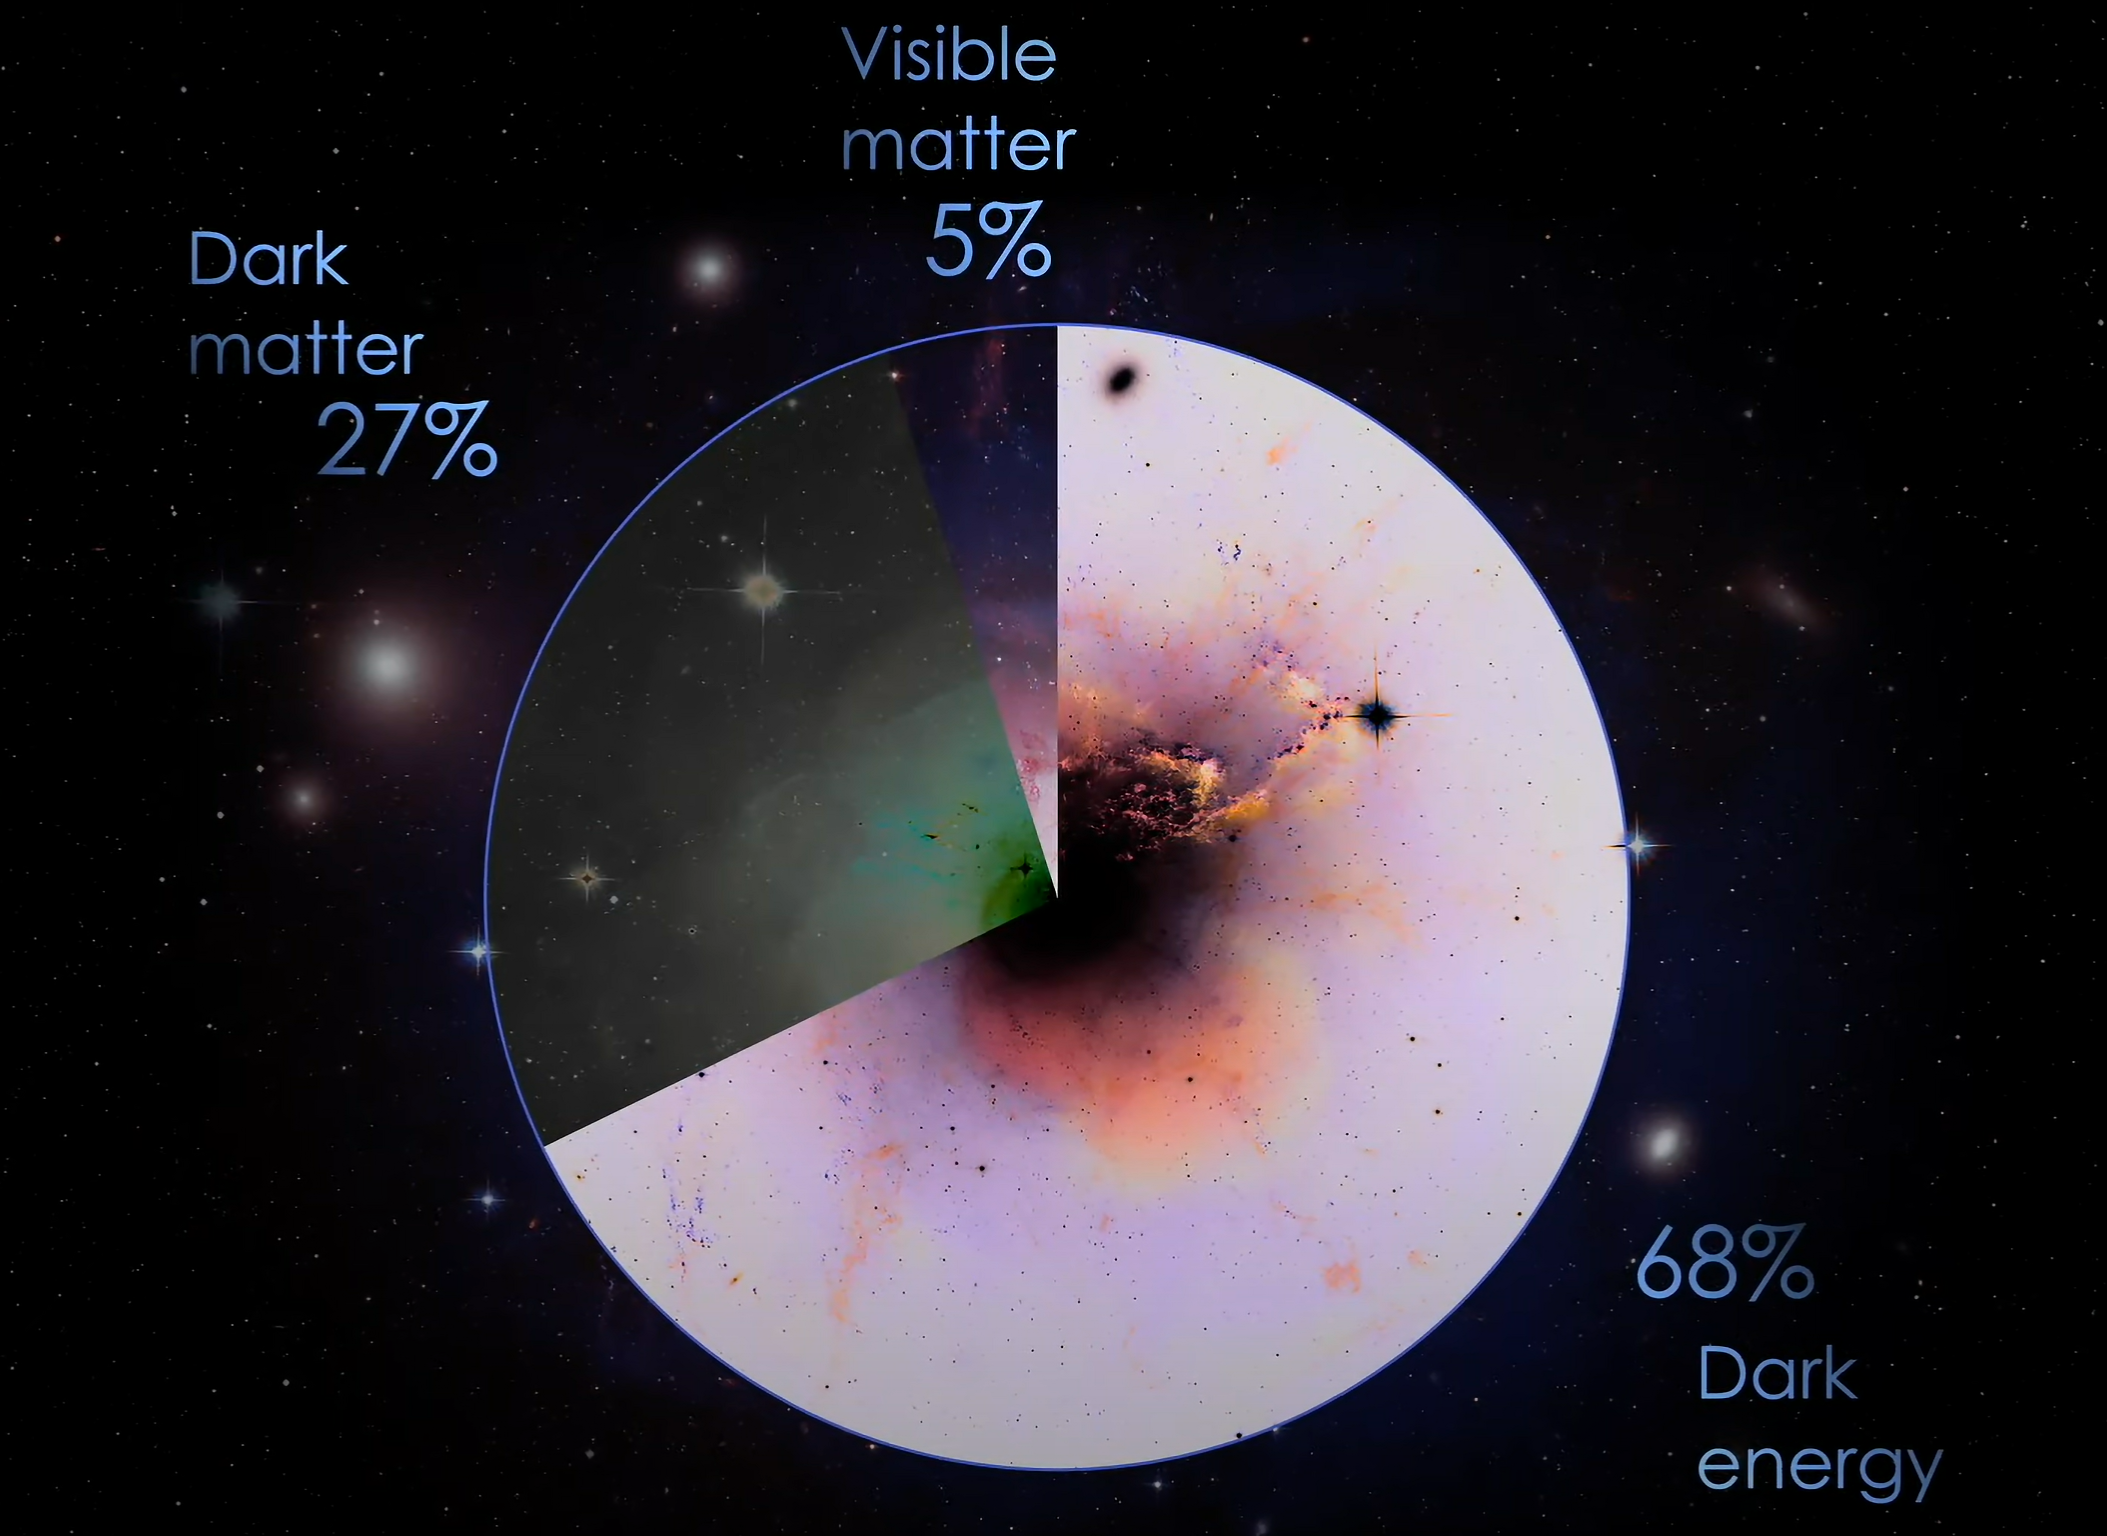
Researchers have used the Dark Energy Spectroscopic Instrument to make the largest 3D map of our [local] universe and world-leading measurements of dark energy, the mysterious cause of its accelerating expansion. source. Longer 22 minute video on this endeavor.